- Does not require constant web access
- Simple to use, understanding KML not necessary
- Works with any user generated set of polygons and palette
- Automatically produces a key and the processed polygons can be queried in the main Google Earth window.
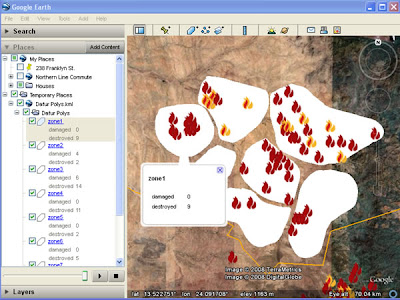
 Raw Data: This is a screenshot of user generated polygons* with a simple html table of data in each polygon. In this case the data are the number of damaged and destroyed villages (from the Dafur Layer) in each polygon. Note that you cannot click the polygon to get the description like a placemark, the polygon description has to be accessed through the places column.
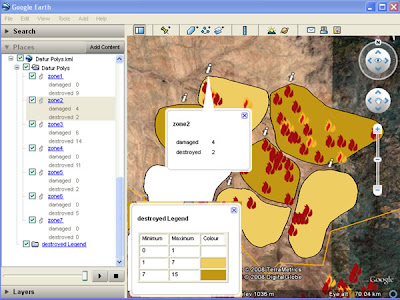
Processed data: After using the tool, the polygons are converted to a color coded thematic map, a key is automatically generated and a 'i' placemark produced which can be queried from the main screen to show the data. (note for simplicity the legend has been copied in afterwards, in real use the legend appears center screen and legend and pop up balloon cannot be visible at the same time)
Relationship to GIS: The idea for this tool came from discussions with Nigel Woof of MapAction and my boss Dave Martin. In GIS a lot of data is stored as attribute tables attached to Polygons, e.g. a table of the number of male/female/sick refugees is linked to a series of polygons showing refugee camps. This is a useful format but not possible in Google Earth. After discussions with Ducan Hornby of GeoData (who has done all the coding) we decided to have a go at producing a tool that could enable this.
Scrappy Maps: The original idea was to allow an Aid worker in the field to produce thematic scrappy maps , this means that TMapper must be usable in areas of poor web connection and should be simple to operate. E.g. a worker helping in the China earthquake disaster can quickly digitize the borders of a series of reservoirs and attach data such as distance from earthquake epicenter and volume of water.
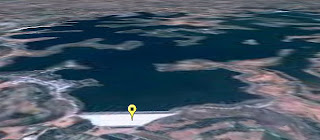
 View of a Dam and resevoir that could be damaged due to the recent Chinese Earthquake, taken from Mark Mulligan's Dam GeoWiki via Ogleearth
Two separate thematic maps can be produced (one for volume one for distance) using our tool and compared by using the layers control in the places column.
Related Work: Bjørn Sandvik has produced some thematic maps in Google Earth but he uses php which requires web access or a fiddly PC based server. Kaitlin Duck Sherwood has produced Mapeteria which also produces thematic maps but that requires a web connection and only works for predefined polygon sets.
.NET and KML format: Part of the justification for doing this was that Duncan wanted to explore working with .NET VB so our tool is written in this language. After defining a palette, the tool writes a series of polygon styles that color the fill of the polygons. Individual polygons are linked to the styles depending on the value of the variable in their descriptions. The tool produces the 'i' placemark via multigeometry (another multigeometry example) . Finally, the tool automatically produces a KML folder with a simple html table in the description which has a key in it.
Demo: A demo of the tool in action
(note big download)
Next Steps: We would like to release the tool but we are having installation issues as the program appears to be fussy about the version of .NET installed so these need to be cleared before release. We would be grateful of feedback from the developer community about choice of alternative language to produce this in and the Aid community in terms of its applications. Further work would see us produce a key via screen overlay, get the 'i' to plot itself just inside the polygon rather than outside and allow palettes to be saved for reuse.
*I just made them up, they could be river basins or administrative districts.
No comments:
Post a Comment