Tuesday, September 30, 2008

Hurricane Gustav Project Review

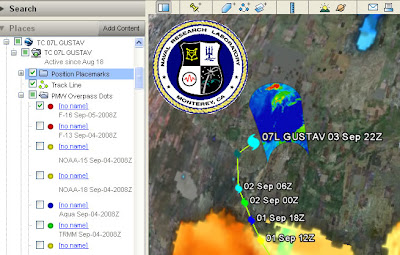
The US Naval Research Laboratory has released a Google Earth project showing information about the progress of Hurricane Gustav. It pulls in data from satellites and shows all sorts of data. It is impressive in its scope but the design could be improved.


Screen shot of the Google Earth project showing satellite data for hurricane Gustav

I'm too busy to give this a full review but here's some points you can see from the screen shot.
  1. Introduction: Its there, but its overlong. Text is black on a dark gray background which is difficult to read. There is a link to a 28 page instruction manual, I'm afraid its difficult to get the public to read 28 sentences about how to use your project let alone 28 pages.
  2. Acronyms: TC 07L, PMW, F-16 and TRMM acronyms are all visible on screen, the public won't know what they mean.
  3. Shield: The Naval Research Laboratory shield screen overlay is too big and busy. You can turn it off and the design may be out of control of the people putting the file together but they could have reduced it in size or made it semi transparent.
  4. Rollover behavior: The blue inset screen you can see right and below the shield appears when you roll your mouse over a red dot ('no name' title in the places column). Its remotely sensed data but the key to the data is held elsewhere. It would be better to put it in a pop up window that works with a toggle click for on/off. Keys should automatically appear with the data that they apply to.
  5. No name: What are the red, yellow, green and blue circles in the places column? They are in the PMW Overpass Dots folder but have no names. There is no information in the icons themselves (i.e. they aren't shaped like a satellite to give us a visual clue). There is gray text information about what they are but mostly it's in acronyms and gray text gives the visual message 'extra non crucial information', it would be better to rename the titles.
  6. Orange Gulf of Mexico? (bottom of image). It's that color because its showing sea surface temperature. You click a link from within a pop up box and, without warning you, a new KMZ file opens, named (in this case) "20080902.0000.ghrsst.sst.global (1440)". Now, if you're smart you can interpret this as a global image taken on 2nd Sep 2008. But you probably won't know SST is sea surface temperature. The file also appears without an associated key so you can't work out what the colors mean. If data pops up in a separate kmz file like this the user should be warned so they can find it if they want to turn it off.
A huge amount of work has gone into this project and its not all bad. The hurricane icons work nicely, data does not all turn on when you first open the file and the links to big data sets (the SST file is an example) is good design as it doesn't overload the graphics card of your computer with lots of data. I'm also impressed by the large range of data that has been collated here. However, its a shame that the effort has been misplaced, users just won't read pages of instructions or hunt out the key for the data they're looking for in a folder structure. Overall not enough thought has gone into how a non expert audience will use the project which is a shame because Google Earth projects about hurricanes are enormously popular (especially when they can be viewed in real time as this one was).

LATER: In archiving the project for my records I found bits and pieces I hadn't seen earlier (as I said, I did this at speed because of time pressures). That made some of the points I'd made unfair so I rewrote the post correcting these points and also making the language more neutral than it was in the original. If anyone saw the original, I withdraw my comments.

Thursday, September 25, 2008

This blog in a Picture


by Wordle via Memex 1.1

Generated from this blog's text over the last 3 months, it would be nice on top of a cake don't you think?

Wednesday, September 24, 2008

Timeline HowTo

The timeline is the feature of Google Earth that allows time animation. The screen shot below shows some time tagged placemarks of a group of our geography students going up the Arrolla glacier earlier this month*


Animation of a student field work hike up a glacier near Arrolla

Arrolla Glacier Walk GEarth File

The Google timeline documentation is fairly useful for the basics but leaves users a bit confused over some issues so here are some timeline tips:

Can't get the timeline to show? To get the timeline to show you need to have time stamped data somewhere in your places column. The relevant data must also be visible (i.e. radio button ticked in the places column).

Timeline is visible but not showing what you expected? Once the timeline is visible:
1. Click the clock icon on its far left and select 'restrict time to currently selected folder'.
2. Click the folder (or sub folder) in the places column holding the data you want to view
3. The folder should get a blue background. Make sure its radio button is clicked too.
4. Check if the timeline is now working as expected, if not go onto time range tip.

Time range tip: The timeline shows the complete range of data from the oldest to the youngest time stamped data in your selected folder (if you have selected 'restrict time to current folder' option as listed above).

Imagine you have selected and ticked a parent folder (selected folders have a blue background) that holds 3 sub folders. The 3 sub folders contain GPS data from 1st of May 1975, 2 July 2008 and 1 Sep 2008 respectively. In this situation the timeline will animate from 1 May 1975 to 1 Sep 2008; if you click the 'play' button on the timeline the data from 1 May 75 will briefly show on screen, then nothing will show at all as the timeline animates through all the days from 2 May 75 to 1 Jul 08. Finally there will be a brief flash of data as the timeline passes 2 Jul and 1 Sep.

The solution is to untick certain folders within a parent folder so that a smaller time range is shown. Alternatively, select and tick a subfolder instead of the parent folder.

Shadow Shading: Just to show what it could do, I turned on the 'sunlight' button on in Google Earth and captured the effect in the film clip. It shades the backs of the mountains quite nicely but looks odd because it fails to animate the shadow that the peak (center right of screen) cast over the valley at the time the imagery was acquired.

*The GPS automatically recorded their position every 2 seconds, each of these data points plots as a placemark. The timeline shows a 'spread of time' so at any point in the animation you will see a number of placemarks showing. If they're bunched together, the group was slow moving or stationary. If they are spread apart it shows the group was moving at speed. Where the placemarks dissapear altogether its because the GPS lost signal because of the mountains.

Thursday, September 18, 2008

Google Geo Education Summit

On Friday I was invited to this event at the Google offices in London. Ollie has blogged the event in detail amongst others.

It was a very useful event, it was great to finally meet Tina Ordruff of Google and Noel Jenkins of Juicy Geography fame both of whom I've had phone conversations with before about Education matters. Jamie Buchanan-Dunlop of digital explorer presented along with Tina, Noel and myself, pleased to hear he's finally got enough project work in Google related education to drop teaching and concentrate on it full time. Ollie was there amongst others who it was good to meet.

I won't blog things in detail as time is tight for me at the moment however some notes that struck home for me:

Students better than Teachers: I think Ollie suggested this one, we should be encouraging school students to use Google Earth in their work even if it the teacher isn't using Google Earth much themselves.

Google Earth as gaming environment: Jamie outlined this in his presentation. The new Google Earth plugin allows web programmers to build tools involving the 3D engine of Google Earth easily and things involving games are attractive to students. This idea has pros and cons: concepts such as scoring, lives, competition, ramping up difficulty so that no instructions need to be read can be great motivators for students. The plugin allows techies to build these edu-games with little development time. However, I've read a paper where use was made of edu-games and testing showed that although the students enjoyed playing the games and thought they'd learnt things in fact they only developed superficial knowledge. As with many things in elearning, there are lots of ways edu-games could fail but tremendous potential in the concept.

Local vs Global: In my lesson plan I thought the fact that the content was about India would be exotic and interesting to teachers and students. In contrast consensus amongst the teachers at the meeting was that local mapping was a powerful teaching aid as students got to grasp the relationship between map and reality. Jamie has developed a fascinating school grounds project along these lines that I might adapt for University use.

Virtual Scout: Noel talked about how he gets students to scout around Svalbard via Google Earth in one of his lesson plans, this is a concept I've come across myself in developing materials - there is evidence of giant lakes (much bigger than the great lakes) in the USA in glacial times that can be found by using the terrain and imagery data within Google Earth. Students can be taught how to identify something and then virtually 'sent' to find other examples in a given area. Really good teaching practice.

GIS in Schools: Although there are a number of free GIS products around for schools none of them really hit the mark according to the teachers present. I also learnt that A and GCSE curricula both have GIS explicitly mentioned. Google Earth could be easily adapted for this use.

Tina came to visit us in Southampton on Tuesday and we discussed even more educational topics. Hopefully more of that later.

Wednesday, September 17, 2008

Web 2.0, Google Map design and Map of News Stories

Three Talks: I have a list of things I'd like to blog about, just recently its been growing ever longer as I find more interesting stuff on the web but have less time to write. This post is an attempt to shorten the list down by writing in brief about 3 talks I've come across that are related to, but not directly about, design in Google Earth.

Relationship to Web 2.0: Google Earth is an example of a Web 2.0 technology, Clay Shirky gives an entertaining talk about how web 2.0 is working including discussion of crime mapping in Brazil. Well worth watching in full.

Google Map Design: Googler Pam Fox gives details of a talk she gave about design in Google Maps. Producing content in Google maps is similar to Google Earth, its a lot more technical for the producer but it can be embedded in a web page which is a considerable advantage. She starts by saying:

"You can't just throw your data on a map and call it a day. Your users deserve more than that."
Amen to that.

I also liked the 'Markers as Links', idea that she discusses but I didn't like the design on slide 9. Yes, its different from the default Google Maps design but it uses too much intense red, a better design would have used a more subtle color.

Map of USA News: Alisa Miller describes what is, at the current time, my favourite static map: The amount of US news about the world shown as a distortion of land mass.

Click to expand


If I could find a high definition version out there I'd stick it on my wall.

Tuesday, September 9, 2008

Tutorials update including 'Writing Introductions'

I've previously posted about introductions to Google Earth projects by text1 , by text2 and by video .

today I've combined and updated the web tutorials with a new section on Introductions.

I've also updated some of the navigation on the tutorials, included a revamped section of video clip examples and provided a new section: 'further study' links. This is a selection of key posts from this blog on advanced map making with Google Earth.

Monday, September 8, 2008

Wallis Award: Southampton University Campus Map

Often on this blog I criticize the use of 3D in thematic maps. Today I'm pleased to promote a map that is 3D to show buildings which has been awarded the Society of Cartographers Wallis award for excellence in cartography:

NW Section of the Campus Map

It's been produced by my colleagues in the Cartographic Unit here at Southampton. Its a lovely example of how the type of 3D view Google Earth produces can be improved upon. The cartographers took a block view of the buildings (not from Google Earth) and then interpreted it to improve clarity. Using 3D and choosing the particular view was an excellent choice, the section of the campus I've reproduced above shows a particularly tricky part of the campus to navigate as there are multiple tall buildings around with a maze of entries. By showing the buildings in 3D it is easy to separate which building is which to navigate your way around.

Well done Carto! (as we call them in the school)

Saturday, September 6, 2008

Democratic Website Sucks

This post is about web design rather than Google Earth design.

How to lose viewers: So I wanted to watch Al Gore's speech to the democratic convention, here's the official link. If you go there with Firefox 2 without the right plugin it asks you to download one. Doh! democrats, if you want to get people to watch your speeches then don't make them download a special plugin, hoards of them will not bother. Look on Youtube and of course, the speech is there for all to see using flash, which pretty much everyone has.

Monday, September 1, 2008

Ed Parsons calls for a 'New Cartography'

SatNavs Lack Detail?: Its still the silly season for news in the UK and people from the British Cartographic Society (BCS) have had their 15 minutes of fame on the BBC by criticizing the lack of good old British landmarks on SatNavs. Ed Parson's rightly defends the neo-geographer's point of view by outlining the silliness of this comment and I agree with him, of course you shouldn't have churches and museums on a SatNav, it cramps up the view and you want it to be relatively sparse of detail so you can turn on layers like churches and museums at will.

New Cartography:

Ed goes on to say:
"That’s not to say the principals of design are not important in the creation of “maps” for screen display, indeed one could argue for the need of a "new" cartography which adopts rather than ignores the capabilities of screen based maps to portray information dynamically."
If you're new to this blog: Over the last year I have been arguing on this blog for such a "New Cartography". I have discussed the principles of geo-web design (27 posts) by examining best practicises from cartography, GIS and web usability design. With Steve Chilton, Chair of the Society of Cartographers I've mulled over the relationship between cartographers, neo-geographers and the GIS community. And more.

Analogy with Animated Film: Ed goes onto to discuss an analogy between the geo-web and the development of computer generated animation:
"In the early 1990’s Disney Animation Studios was having great success with movies such as the Lion King, Aladdin and Beauty and the Beast. Indeed they opened up an animation studio ... ... so that visitors could see animators working ... ...it was shut down in 2004, when Disney stopped it’s traditional animation efforts, as it began concentrating on its own computer generated efforts..."
Its a good analogy to the development of the geo-web but a particular Disney film deserves further consideration:

Sequence from Tron

Tron became a cult film because of its innovative use of computer animation and video game look. However, it actually doesn't use that much computer animation, traditional techniques were widely used and matching the new and old technologies together in one film meant it was actually more time consuming to produce than a traditional hand drawn animation.

Bad Use of Technology: My point is that the development of a new technology isn't a simple switch from old to new, as Tron shows there is often an intermediate phase where the new technology actually makes things worse before we learn how to really use the tools properly and reap the benefits. I'd characterize these periods as 'old', 'wrong' and 'right' and at the current time I think the geo-web is firmly in the 'wrong' part of the cycle because of a lack of understanding about design. Exactly the same situation occurred in the development of the web.

Wake up Cartographers: IMHO the BCS needs to think clearly about what it is saying, comments about the loss of churches on SatNavs is as silly as bemoaning the disappearance of chimney sweeps in an age of central heating. As Steve Chilton admitted in his interview with me about cartography and GIS:
"Cartographers in general did not interact with the GIS producers to influence these matters as software and techniques were developed, a certain conservatism and resistance to change was evident."
if cartographers behave the same way about the geo-web and fail to shows understanding of its latest developments neo-geographers won't bother to listen to what they have to say about it and boy, do neo-geographers have an awful lot to learn about map design.

3rd Sep: since I wrote this post I've been in email contact with Mary Spence about the article. I'll add her email as comments so interested parties can see the exchange. She feels that her views were not well represented by the BBC. Rereading the 'wake up cartographers' section of this post I think I put my point too strongly, I didn't mean to insinuate that cartographers aren't up on the latest technologies, I should have limited myself to criticizing the message that appeared on the BBC.